


CLEVELAND — Voters headed to the polls Tuesday in Cleveland as the city searches for its next mayor.
While residents contemplate the city’s future, a new report from the Center for Community Solutions highlights where Cleveland’s 34 neighborhoods currently stand when it comes to population growth, poverty, education, and other critical data points.
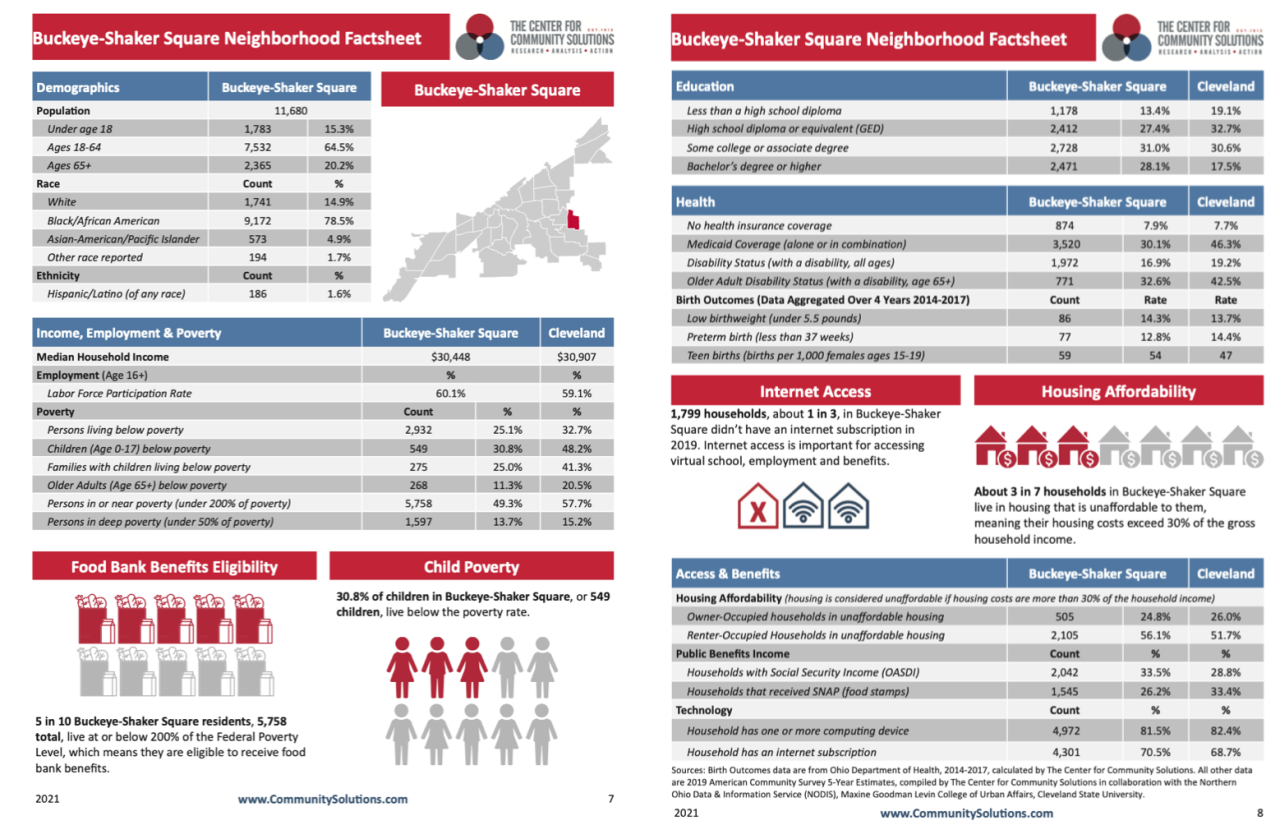
The report is based on pre-pandemic data from 2019, and gives a more detailed look at individual neighborhoods, which associate director Emily Campbell says can vary widely.
“Neighborhoods aren’t a geography that exists in most data," she said. “We’re starting to see some of the differences get a little bit larger between the various neighborhoods within the city."
The Center for Community Solutions is a non-partisan, non-profit policy and research think tank.
Census data released last month already reminded Clevelanders that its population is on the decline, losing nearly 24,000 residents over the past decade, while Cincinnati and Columbus grew significantly, and the state’s population increased by a sluggish 2.3% compared to national growth of 7.4%.
However, the report highlights how some neighborhoods actually saw an increase in population, specifically on the West Side, including Jefferson, Stockyards and Downtown.
.@CommunitySols neighborhood profiles show pop. growth/loss trends (2016-2019); most pop. growth concentrated in few adjoining neighborhoods; Jefferson, Cudell, West Boulevard, Clark-Fulton, Stockyards, Edgewater, Detroit Shoreway, + Brooklyn Center https://t.co/hR6VuQRPMq
— John Corlett (@CommunitySolsED) September 13, 2021
While a population increase would normally be a good sign for a city, that’s not necessarily the case, Campbell said.
“Disinvestment in some places and investment in other places,” she said. “Unfortunately, a lot of this breaks down to racial equity lines. In those neighborhoods that were formerly red-lined, we're seeing things continue to get worse, even higher concentrations of segregation in some of these areas. So we’re a little concerned about where Cleveland is heading despite the fact that across the board, there are some things that have gotten better.”
The report addresses the City of Cleveland’s poverty rate, which fell nearly 9% from 2016 to 2019. At the same time, how poverty was distributed throughout the city remained the same, with neighborhoods on the east seeing the highest poverty rates.
While neighborhoods varied on several key issues, others transcended boundaries.
As a whole, the report shows how renters in Cleveland still struggle to pay for housing, with more than half of all renters in the city spending more than 30% of their income on rent alone.
The highest rates of unaffordable housing occurred in neighborhoods such as Clark-Fulton and Collinwood-Nottingham.
“What that means is they don’t have money left over for lots of other things,” Campbell said. “It can put a lot of stress on families.”
Going forward, Campbell told News 5 she would love to see this neighborhood-focused data lead to change in more ways than one.
“We’re hoping people can use it to get a better sense of what's happening,” Campbell said. “To confirm or deny what they may be observing happening in their neighborhoods and use it to make decisions about where to focus energy and resources going forward.”
To view the full report and learn more about a specific neighborhood, click here.
