
As part of our continuing coverage of the coronavirus pandemic, News 5 is presenting visualizations of key COVID-19 data for our state and counties, including Ohio cases, hospitalizations, deaths, vaccinations and testing. View these new, updated data visualizations below. New data is added automatically to these visualizations each day.
Cases
Statewide COVID-19 cases (last 30 days, per 1,000 people):
Click here to view more statewide case, death and hospitalization data from the Ohio Department of Health.
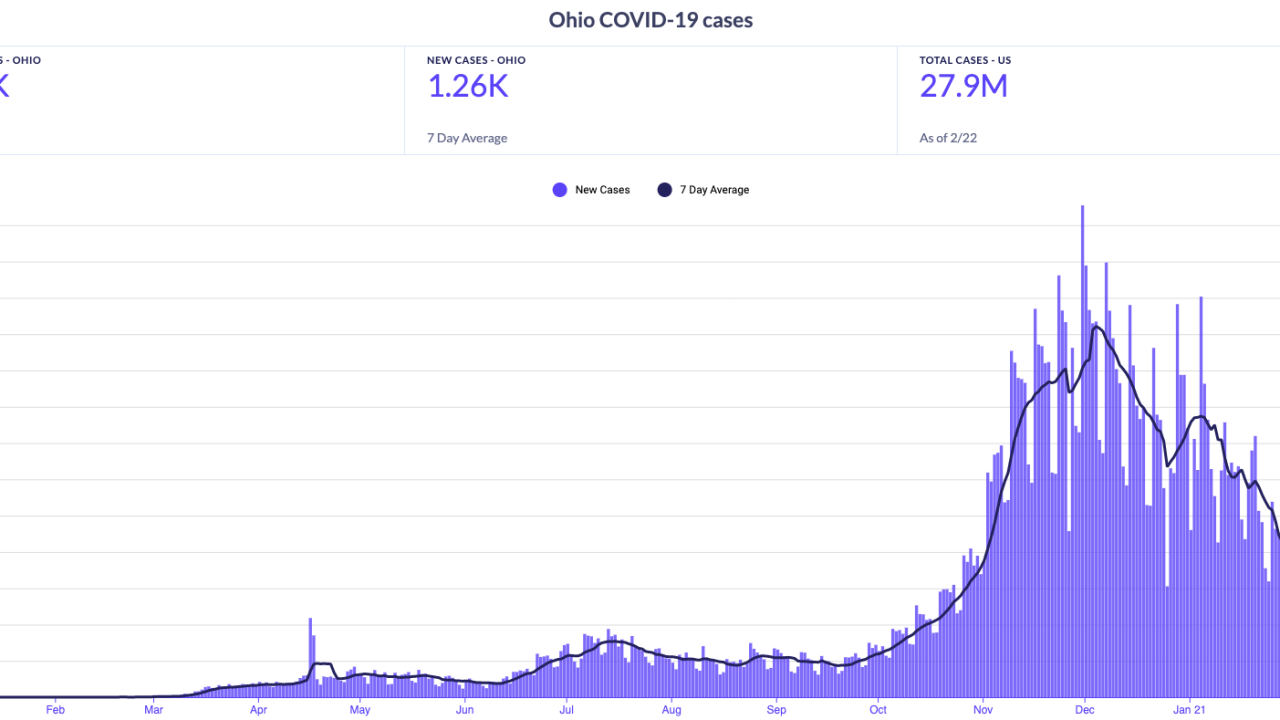
New daily cases in Ohio:
New daily cases in Cuyahoga County:
Deaths
COVID-19-related deaths in Ohio:
COVID-19-related deaths in Cuyahoga County:
Click here to view more data on current COVID-19 case, death and hospitalization trends from the ODH.
Hospitalizations and ICU usage
Number of patients currently hospitalized and in the ICU for COVID-19 in Ohio:
Click here to view more statewide hospitalization and ICU utilization data from the ODH.
COVID-19 vaccinations
Map of COVID-19 vaccination rates by county:
Vaccination rate over time by county:
Ohio's vaccination rate compared to other states:
Click here to view more vaccination data from ODH.
COVID-19 testing
Daily new tests and test positivity rate in Ohio:
Click here to view more COVID-19 testing data from the ODH.
Click here to view our previous visualizations, which were updated daily using different graphics until Feb. 23, 2021.